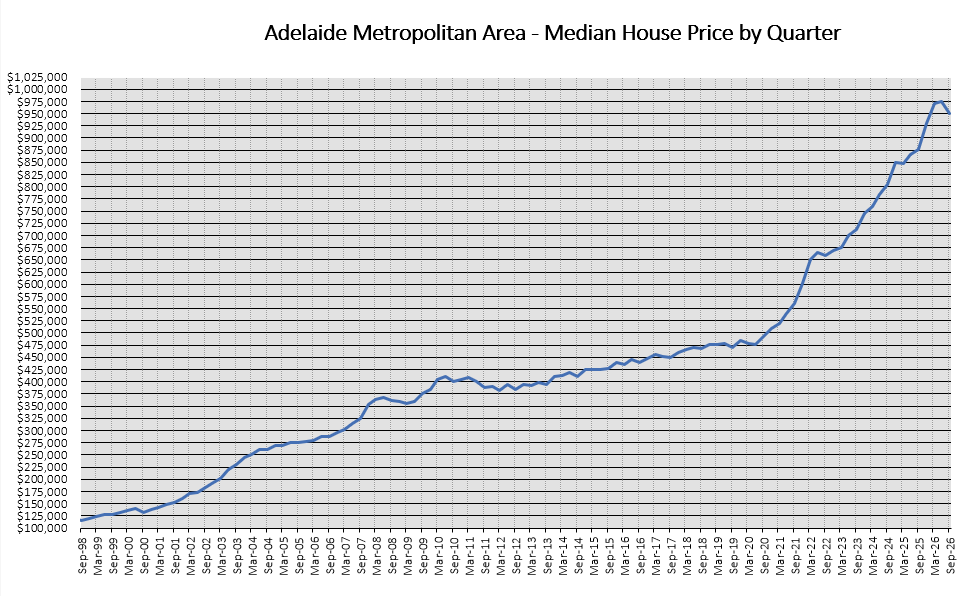
Median house sales by quarter The median sale price of houses in metropolitan Adelaide and major non-metropolitan South Australian towns by quarter is available below.
The median sale price represents the midpoint of all house sales recorded during the three-month period. When interpreting short-term data, it is important to note that a relatively small number of sales, variations in the types of properties sold, and fluctuations at the suburb level may not accurately reflect genuine changes in market conditions. As a result, short-term movements should be viewed with caution, as longer-term trends may present a different and more reliable outlook.
Further information regarding median house prices for metropolitan Adelaide by suburb , including the number of sales in each suburb and median percentage change, are available on the DATA SA website.
2026 - 2027 Quarter Metropolitan Adelaide Non-metro (major towns) Sep 2026 $950,000 $546,000 Jun 2026 $975,000 $550,000 Mar 2026 $970,000 $555,500
2024 - 2025 Quarter Metropolitan Adelaide Non-metro (major towns) Dec 2025 $930,000 $520,000 Sep 2025 $875,000 $485,000 Jun 2025 $865,000 $465,000 Mar 2025 $847,000 $460,000 Dec 2024 $850,000 $454,000 Sep 2024 $803,000 $430,000 Jun 2024 $785,000 $420,500 Mar 2024 $760,000 $415,000
2022-2023
Quarter Metropolitan Adelaide Non-metro (major towns) Dec 2023 $745,000 $395,000 Sep 2023 $712,000 $385,000 Jun 2023 $700,000 $365,000 Mar 2023
$675,000
$375,000 Dec 2022 $670,000 $350,000 Sep 2022 $658,000 $334,764 Jun 2022 $665,000 $337,250 Mar 2022
$650,000
$325,000
2020-2021
Quarter Metropolitan Adelaide Non-metro (major towns)
Dec 2021
$600,500
$295,000
Sep 2021
$560,000
$279,000
Jun 2021
$540,000
$280,000
Mar 2021
$520,000
$281,875
Dec 2020
$510,150
$272,000
Sep 2020
$492,000
$272,000
Jun 2020
$477,375
$278,000
Mar 2020
$479,000
$270,000
2018-2019
Quarter Metropolitan Adelaide Non-metro (major towns)
Dec 2019
$485,000
$280,000
Sep 2019
$471,000
$265,000
Jun 2019
$479,000
$269,000
Mar 2019
$476,000
$272,000
Dec 2018
$475,500
$275,000
Sep 2018
$469,000
$270,000
Jun 2018
$470,000
$267,750
Mar 2018
$466,000
$270,000
2016-2017
Quarter Metropolitan Adelaide Non-metro (major towns)
Dec 2017
$460,500
$260,000
Sep 2017
$450,000
$265,000
Jun 2017
$452,000
$264,500
Mar 2017
$455,000
$268,000
Dec 2016
$447,500
$262,000
Sep 2016
$439,700
$270,000
Jun 2016
$446,000
$262,500
Mar 2016
$436,000
$267,250
2014-2015
Quarter Metropolitan Adelaide Non-metro (major towns)
Dec 2015
$440,000
$260,000
Sep 2015
$428,000
$250,000
Jun 2015
$426,000
$255,000
Mar 2015
$425,000
$265,000
Dec 2014
$425,000
$260,000
Sep 2014
$411,000
$255,000
Jun 2014
$418,000
$255,000
Mar 2014
$412,800
$268,000
2012-2013
Quarter Metropolitan Adelaide Non-metro (major towns)
Dec 2013
$410,000
$260,000
Sep 2013
$395,000
$262,500
Jun 2013
$398,250
$250,600
Mar 2013
$393,000
$260,000
Dec 2012
$395,000
$250,000
Sep 2012
$385,000
$256,500
Jun 2012
$392,750
$255,000
Mar 2012
$381,000
$260,000
2011
Quarter Metropolitan Adelaide Non-metro (major towns)
Dec 2011
$390,000
$250,000
Sep 2011
$387,750
$240,000
Jun 2011
$400,000
$269,750
Mar 2011
$407,750
$280,000
Page last updated: 16 October 2026